
Charts/Graphs on Home Page Extension for VTiger
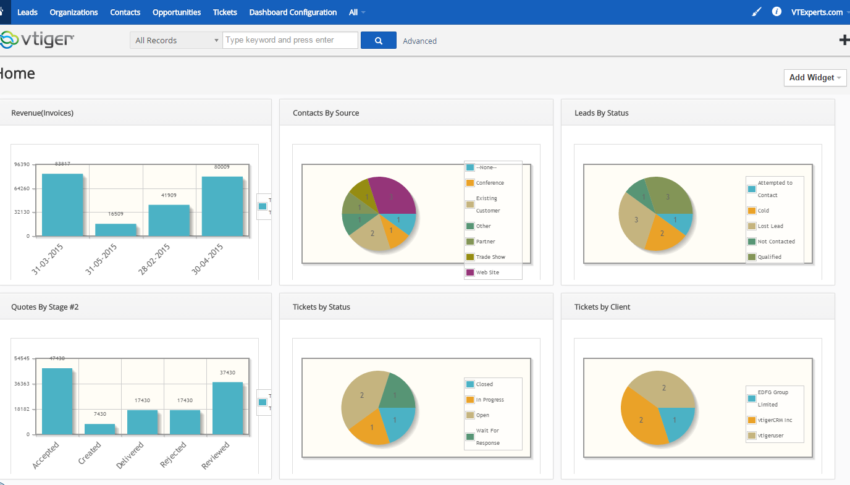
Wouldn’t it be nice to see all of your stats on the dashboard of your CRM when you log in? Any number you need, right at your fingertips? Thanks to the Charts/Graphs on Home Page extension for VTiger, that’s precisely what you can do.
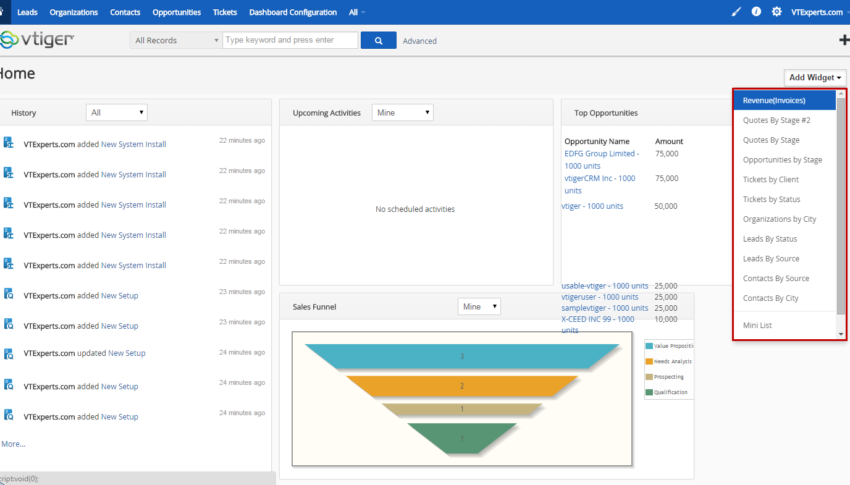
It allows you to use Chart/Graph report data and display it on the dashboard. It supports all types of graphs (pie, bar, line) + you can open full reports right from the dashboard.
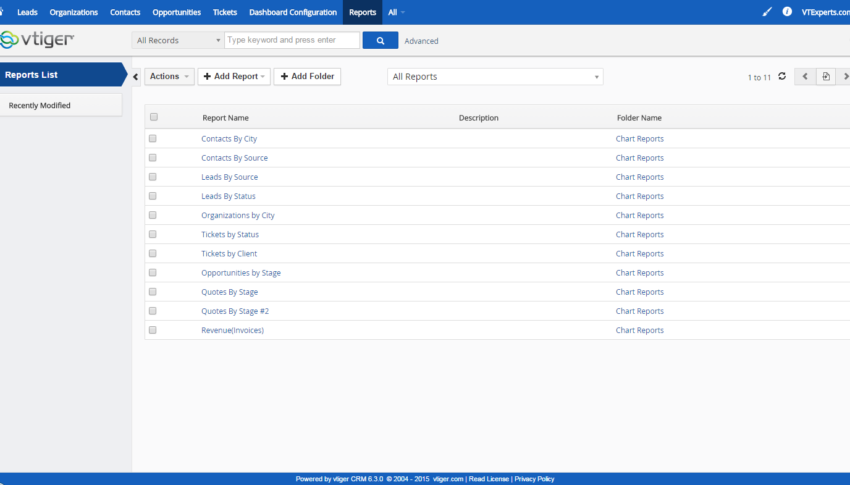
You can create standard or customized reports on any figure that your business requirements, and display only the information you want. The rest of the information stays out of sight until you need to access it. The Charts/Graphs on Home Page extension for VTiger is easily integrated with both customized and standard VTiger modules, so you can upload it into VTiger with ease, and start using immediately.
Here are some of the key features that make our extension unique:
- Allows to place any Graph/Chart Report on the Homepage (Dashboards) of VTiger
- Supports All Standard & Custom Reports
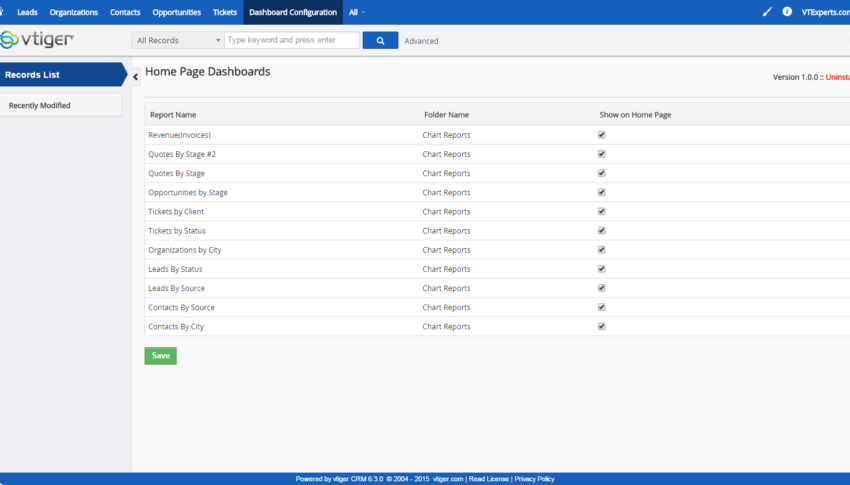
- Easy to configure panel with the ability to specify which reports to display
- Compatible with VTiger Standard & Custom Modules
- Module Manager Compatible
- Available on VTiger Marketplace
We provide a unique demo instance for all our extensions. Each demo instance is pre-configured to only show features available for the specific extension. It is likely that some of the standard vTiger modules have been disabled to make the demo more user friendly.
Please use credentials below to access the demo.
- Link: http://demo.vtexperts.com/dashboardcharts/index.php (Will open in new window)
- User: demo
- Pass: demo
If you are not able to access the demo or find an issue - please send us an email at support@vtexperts.com or via contact form.
5 reviews for Charts/Graphs on Home Page Extension for VTiger
Related products
-
Google Address
Rated 5 out of 5 -
Profit Calculator Extension for VTiger
Rated 5 out of 5 -
Price Markup Extension for VTiger
Rated 5 out of 5
Wouldn’t it be nice to see all of your stats on the dashboard of your CRM when you log in? Any number you need, right at your fingertips? Thanks to the Charts/Graphs on Home Page extension for VTiger, that’s precisely what you can do.
It allows you to use Chart/Graph report data and display it on the dashboard. It supports all types of graphs (pie, bar, line) + you can open full reports right from the dashboard.
You can create standard or customized reports on any figure that your business requirements, and display only the information you want. The rest of the information stays out of sight until you need to access it. The Charts/Graphs on Home Page extension for VTiger is easily integrated with both customized and standard VTiger modules, so you can upload it into VTiger with ease, and start using immediately.
Here are some of the key features that make our extension unique:
- Allows to place any Graph/Chart Report on the Homepage (Dashboards) of VTiger
- Supports All Standard & Custom Reports
- Easy to configure panel with the ability to specify which reports to display
- Compatible with VTiger Standard & Custom Modules
- Module Manager Compatible
- Available on VTiger Marketplace
We provide a unique demo instance for all our extensions. Each demo instance is pre-configured to only show features available for the specific extension. It is likely that some of the standard vTiger modules have been disabled to make the demo more user friendly.
Please use credentials below to access the demo.
- Link: http://demo.vtexperts.com/dashboardcharts/index.php (Will open in new window)
- User: demo
- Pass: demo
If you are not able to access the demo or find an issue - please send us an email at support@vtexperts.com or via contact form.
5 reviews for Charts/Graphs on Home Page Extension for VTiger
-
Rated 5 out of 5
Steve (verified owner) –
The visualizations are awesome
-
Rated 5 out of 5
Vlad (verified owner) –
these graphs are extremely helpful and display about full summary on main
-
Rated 5 out of 5
Joaquim (verified owner) –
thank u guys for this one
-
Rated 5 out of 5
Jade (verified owner) –
i contacted tom and feedback from tom and developers was surprising
-
azehar –
Can we rezise the chart on vt6.5?
Information
- Ioncube & PHP SOAP (hands-on)
- Install & Setup (hands-on)
- Meeting Server Requirements
- Assisting with any issues related to plugins




Steve (verified owner) –
The visualizations are awesome
Vlad (verified owner) –
these graphs are extremely helpful and display about full summary on main
Joaquim (verified owner) –
thank u guys for this one
Jade (verified owner) –
i contacted tom and feedback from tom and developers was surprising
azehar –
Can we rezise the chart on vt6.5?