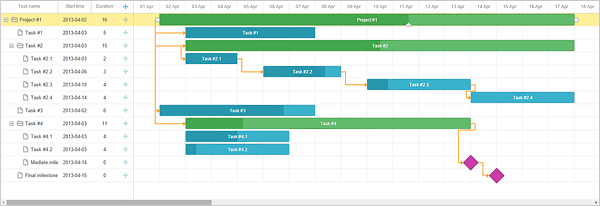
The horizontal bar chart in Project management, that displays stats of a programmed Project Task details that aids in planning, coordinating, and tracking precise tasks in a plan, is known as Gantt chart.
Where to look for Gantt Chart
In Vtiger 7, visit the record view of the Project Module in Project Management App to view Gantt Charts.
Criterion for the Gantt Chart to Appear
A Gantt Chart requires a Start Date as well as an End Date of the Project Task in order to appear in the Vtiger 7.
Editing a Project Task record under Gantt Chart
In a Gantt Chart Project Task record, press the Edit button to modify the record.

Can I reorder the Gantt Chart on a particular Project Task?
No, there is no option provided to rearrange the Project Task records
Is the date field of a specific Project Task from a Gantt Chart adjustable?
Yes! To adjust the date field, simply drag the task layout button.

Change the status color for your own point of view
Press a particular status edit button underneath the Gantt chart, choose a color, apply it and Save.

Note! If a color is not added to any custom status or if the status is blank, then the status color will be white.
Take a Print out of your Project Task Gantt Chart
Use the Print button to get a hard copy of your Gantt Chart report.

Note! A Gantt Chart Report is not downloadable. Also, a report cannot be pinned to the main dashboard.
Organizing Records Column-vise in Gantt Chart
Clicking on the column header will sort the Gantt Chart in ascending or descending order of generation of Project Task. The arrangements can also be changed in the Print Preview view.

No Add / Remove for columns of Gantt Chart table
You cannot add or remove columns from Gantt Chart


